tl;dr: You can’t cheat your way to an ARPA-E grant by gaming the system. The program appears to be run in a remarkably unbiased fashion.
Most folks in energy start-up land know that ARPA-E – the U.S. government agency launched in 2009 to fund high-risk, high-reward energy research – has an open solicitation out for $150 million worth of new grants. So as proposal-writing fingers fly over keyboards, I thought it would be a good time to look at the projects that have won ARPA-E grants to date. (Full disclosure: Two of the nine active companies in our energy portfolio at Venrock have been touched by ARPA-E – Phononic Devices won a grant in the first funding round, and OnChip Power was named as a subcontractor on a power electronics grant.)
ARPA-E works through programs: Solicitations go out on a particular topic, like electric vehicle batteries or efficient air conditioning, and grants on that topic are awarded and managed in one big group. (Occasionally there will be an “open” solicitation that accepts applications on any topic, like the one that’s out now.) Grant winners may be a single organization (like “GE Research”) or, more commonly, a consortium with a single prime contractor and one or more subcontractors (like “Applied Materials partnered with A123Systems and Lawrence Berkeley National Lab”). Generally, multiple programs get awarded together as part of a broader funding event.
If you look at ARPA-E’s web site and add up all the grants that it’s ever announced, you’ll find that $516 million has been awarded to 183 projects across 12 programs during four funding events. (I didn’t get this data from ARPA-E – it’s culled from the agency’s public announcements – so I imagine its internal figures may be slightly different). The vital statistics are below (note that there’s one oddball in the mix – a group of six projects that were awarded in October 2010 separate from any particular solicitation – which I lumped into the “open” category):
So is there a trick to winning an ARPA-E grant? Are you favored if you’re in a certain type of organization, or from a preferred state, or part of some gerrymandered consortium? As far as I can tell, the answer is no. When I study the data, I find that:
Universities win more grants than any other type of prime contractor, but that’s no surprise. Universities have helmed 44% of total winning ARPA-E projects, followed by small companies at 30%. This doesn’t, however, indicate that you need to be at a university or start-up to win a grant – just that these are the places where high-tech innovation tends to arise. Differences between the programs prove this out: For example, lots of start-ups have been funded to pursue grid-scale energy storage and many big companies like ABB and General Atomics have R&D projects in the domain, so it’s unsurprising that the GRIDS program was dominated by these entities. In contrast, the nascent art of coaxing microbes to turn electricity into fuels is practiced almost exclusively at universities and national labs – which, unsurprisingly, claimed more than nine out of ten electrofuels grants.
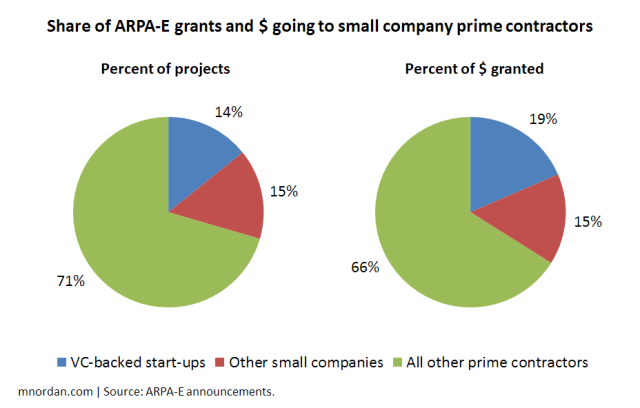
Venture-backed start-ups get no special treatment. The Solyndra debacle created a perception that the Department of Energy favors VC-backed start-up companies rich in political connections. If that’s true, somebody forgot to tell ARPA-E: Projects led by VC-backed start-ups account for only 14% of ARPA-E grants totaling 19% of funds. Further, small companies that lack venture backing have won slightly more grants than those that have it (15% vs. 14%).
Finally, for what it’s worth, I can’t see any relationship between a VC firm’s level of political involvement and its portfolio’s grant-getting success. If that were the case, start-ups backed by the likes of Mohr Davidow Ventures and VantagePoint would be overrepresented among ARPA-E awardees. They’re not.
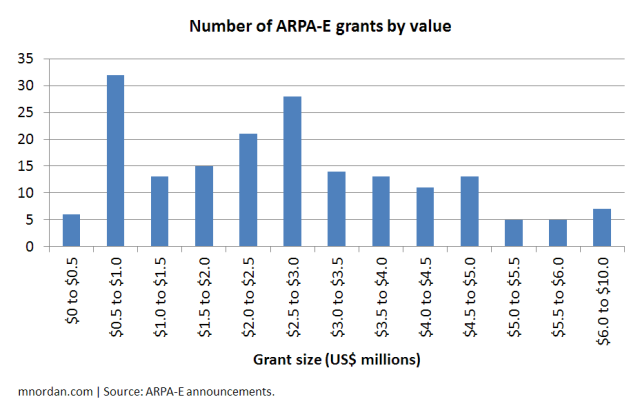
There’s no “sweet-spot” grant size to shoot for. The average ARPA-E grant has awarded $2.8 million, with a range of $397k to $9.2 million (the latter won by laser drilling specialist Foro Energy). But the range is all over the map. As you can see below, it’s not a normal distribution: There’s a big peak for projects in the $500k to $1 million range, but then another for those from $2.5 million to $3 million, and lots of scatter throughout. Better to ask for the amount of money it’s really going to take than try to scale your project toward some optimal target amount.
With that said, grant values have varied quite a bit by program. The air conditioning program BEET-IT exhibits the smallest average grant size of $1.8 million, while open solicitation projects claim the biggest at $3.7 million.
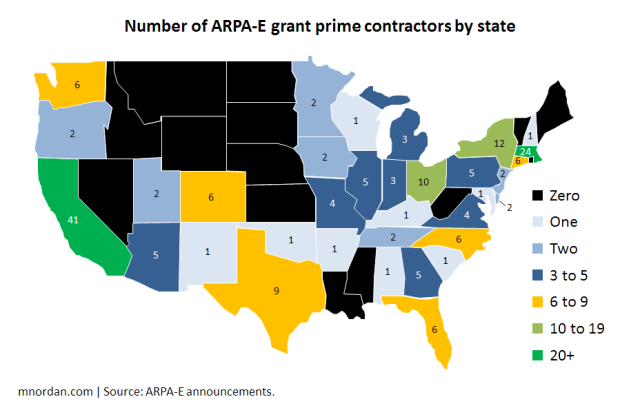
While geographic distribution mirrors tech hubs, 34 states are represented. Only two states claim a double-digit percentage of prime contractors on ARPA-E grants: California and Massachusetts, with 22% and 13% respectively. This should shock nobody, as these two states are home to the country’s two biggest technology clusters. New York snags 7%, Ohio and Texas each have 5%, and 29 additional states are present with a smaller share (i.e., somewhere between one and nine grants). Long story short, a little more than two-thirds of the U.S. is represented among ARPA-E prime contractors, including states like Alabama and Kentucky that aren’t generally known for tech entrepreneurship.
I wanted to see if any states were over- or underrepresented, so I compared the percentage of ARPA-E grants won in each state with the percentage of science and engineering PhDs granted there (using data from the NSF). States with a greater share of ARPA-E grants than PhDs can be considered overrepresented in the program and vice versa. Of the top five grant winners, CA and MA are greatly overrepresented (by +54% and +109%, respectively), whereas Ohio is slightly overrepresented (+28%) and New York and Texas are somewhat underrepresented (-28% and -32%, respectively). I attribute this to the fact that the overrepresented states tend to have robust research and commercialization initiatives around clean energy – the MIT Energy Initiative is a prime example – while such programs seem less prevalent in the underrepresented states.
Piling on more subcontractors won’t help you win a grant. Conventional wisdom holds that Boeing and Lockheed win military deals by subcontracting the work across partners in many states, so that lots of different stakeholders have a vested interest in the winner. This strategy does not appear to work at ARPA-E. The lion’s share of projects have between zero and two subcontractors; only 20% pile on three subcontractors or more. There are substantial program-to-program variations in this regard – the ADEPT power electronics program has an average of 2.7 subs per project, presumably because it requires multiple specialists in the electronics value chain to work together, whereas every winning project in the PETRO energy crops program was a solo entry – but nowhere do large consortia dominate.
So there you have it: ARPA-E is an extraordinary funding resource for energy technology developers, and it appears highly resistant to being gamed. Best of luck to the applicants for this open solicitation – and if you’d like to have an honest and fact-driven discussion about commercializing your technology, feel free to drop me a line.


Excellent analysis, Matthew. Thanks!
Hi Matthew:
thanks for addressing this issue. Too often it seems like folks toil long and hard to get responses into funding opportunities with the federal government and then nothing – zip – zero. It’s like shooting stuff into a black hole …
Keep up the good work. We appreciate your efforts at trying to understand the system!
best regards,
Deborah Deal-Blackwell, APR
http://www.ixpower.com
Lots of good stats in this blog; however, I might draw a different summary statement from the graphic about the financial backing of winners. The “Other” category which covers about 60% of awards presumably includes universities and large tech companies; each of which has internal and other sources of funds for R&D. So a tag line I might draw from the data is “that only 15% of awards go to companies that can’t afford lobbyists or have other institutional funding sources”. Doesn’t make what Matthew wrote incorrect, but there are several ways to draw conclusions from the data. The Open FOA that is on the street now has a section you need to fill out where you list traditional investors that have refused to give you money and why, so it will be interesting to see if the mix remains 85/15 in this next round. Good luck to all.
I meant 70% “Other” of course.
Thanks Ed – very good insight. I wasn’t aware that lobbying on behalf of a proposal was even legal. Now I know. Fortunately for me, I live near D.C. and can probably do some “lobbying” of my own, but that doesn’t seem fair to say a small firm out in Idaho. Much like my feelings about the judge panel on Top Chef, the process/panel should be blind with respect to who is submitting the food – I mean proposal.
Nice job. However, your data suggest that California and Massachusetts are highly overrepresented, and it simply isn’t true that that have more robust research and commercialization. You already corrected for that with Ph.D.s in science and engineering. I believe it has more to do with the fact that Berkeley and MIT have been highly represented in the ARPA-E administration, and they get pretty much anything they apply for — several in each program in many cases.