(A version of this post also appeared at GigaOM.)
tl;dr: Half of successful VC-backed cleantech start-ups stumble along the way. Entrepreneurs who raise big financing rounds at sky-high valuations can end up shooting themselves in the foot.
Most cleantech start-ups require a lot of capital. The average VC-backed company that goes public in this sector raises about $120 million through five rounds of financing along the way.
Every time a CEO seeks new investment, she walks a tightrope. On one hand, she wants to raise capital at a high valuation to minimize dilution. On the other hand, she doesn’t want the valuation to be too high, because if the company loses steam it risks a “down round” ahead – i.e., raising the next round of capital a lower share price than before.
Down rounds dilute the ownership of common shareholders (the founders and employees) quite substantially unless they’re explicitly protected. This is because of anti-dilution provisions designed to protect the existing investors, who hold preferred shares; these terms are part of nearly every institutional financing and are too complex to discuss here. Down rounds can dilute those investors as well, but as long as they can pony up their share of the incoming cash, they can maintain their level of ownership. Common shareholders don’t have this luxury.
Conventional wisdom holds that CEOs should strive for the highest possible share price every time they raise money, because their number one job is to prevent dilution, and down rounds are rare events that only happen in mediocre companies.
A while back, I decided to test whether this actually holds true in cleantech. It’s particularly germane in this sector because of the large amounts of money that must be raised and the many rounds of financing required to reach the finish line.
To perform this analysis, we need time-series data on the share prices of privately-held, VC-backed cleantech start-ups. “But Matthew,” you protest, “private companies rarely publicize their valuations, and they certainly make sure to keep down rounds a secret!” In nearly every case, you’re right, but there’s one instance in which companies are legally required to publish a historical record of their private share prices: When they file to go public. In a happy coincidence, we can presume that companies angling for an IPO have also had some measure of business success. So by examining the SEC filings of public and aspiring-to-be-public cleantech start-ups, we can determine whether successful companies always raise money at ever-higher prices, or whether they tend to stumble along the way.
From trawls through SEC filings, I’ve been able to identify 24 such VC-backed cleantech companies for which private share price histories can be reconstructed – 15 that have gone public since 2000, and nine more that have filed an outstanding S-1. (A handful of additional companies didn’t make the cut because they went public on a foreign exchange with different reporting requirements, they raised only one round of private financing, or they had a really complicated history that I couldn’t untangle.) Here they are:
 You can chart the share price trajectory of each of these companies on a line chart. The x-axis of the chart is time in months, and the y-axis is share price. Each inflection point on the chart represents a fundraising round (Series A, Series B, etc.) at which capital was raised. The lines between the inflection points represent the intervals of time between fundraising events. For the companies that have filed an S-1 but not yet gone public, the last point on the chart represents the share price at the most recent private financing. For the public companies, the last point is the share price at the IPO.
Looking across these 24 companies, three patterns emerge:
 The first pattern is the build, where a company raises successive rounds of financing at steadily higher prices with no single round standing out. This is a good situation for the entrepreneur because it minimizes dilution. A venture investor with 20/20 hindsight would want to play this scenario by investing early and having sufficient follow-on capital to maintain the position, because the earliest investors tend to make the highest returns (both on a cash-on-cash basis and an IRR basis). Biofuels/chemicals company Gevo is a good example of a build:
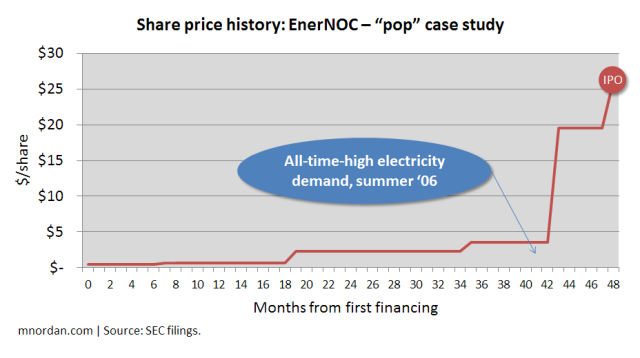
 The second pattern is the pop. In this case, a company raises capital at a modest uptick each time, except for one round where some extraordinary event sends the share price soaring. Entrepreneurs love this situation – particularly if the pop comes late, because it mitigates dilution right when big money is required! A venture investor, in hindsight, would want to get in just before the pop. Demand response pioneer EnerNOC is a great example: Its share price spiked 5.5x from its Series B-1 round to its Series C round, owing (as far as I can tell) to a really hot 2006 summer that broke demand response records.
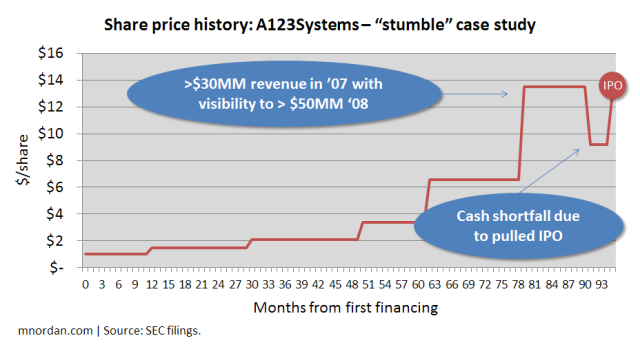
 The third pattern is the stumble. This is the position that no start-up CEO wants to be in, where something goes wrong – unexpected technology hurdle? cancelled deal? management shakeup? – and new financing gets raised at a lower price than before. Theoretically a venture investor with perfect judgment would recognize the dip as a buying opportunity, but in times like these it’s exceedingly difficult to discern a hiccup from free-fall. A123Systems is a good case study: The company attracted more than $100 million at a big uptick in May 2008 in anticipation of an IPO, but had to raise another $100 million at a lower price the next year when the IPO got delayed.
 So, of these 24 companies, how often did each pattern occur?
- Builds happened a third of the time.
- Pops occurred one-sixth of the time.
- Half of the companies stumbled. This is the most common pattern. And these are the successful companies that ultimately filed to go public; just imagine the others!
 The conclusion for cleantech entrepreneurs: Watch what you wish for – you just might get it.
Every time you raise financing there will be a chorus of voices in the boardroom encouraging you to raise the biggest round possible at the highest valuation. Sometimes this will indeed be the right decision, and if you’re certain that it is, you should shoot for the stars. But often – according to this data, at least half the time – it won’t be. Should you get over your ski tips in valuation, you’ll set yourself and your team up for disproprtionate dilution in the future, where your only defense is the mercy of your board. These are the cases where it’s in your personal self-interest to raise the appropriate amount of money at a sustainable valuation from people that you trust – not the largest amount of money at the highest possible price from whoever’s willing to pay it.
Remember, the share price that really matters is the one at the very end.
Tune in tomorrow for some parting thoughts.


great analysis and perspective; thanks
Matthew: This series has been great. Regarding the share price trajectory you cover in this kind of piece, we’ve built a similar analysis and would agree with your observations. A couple of comments:
1) Surprised you left Solyndra out of this analysis. There’s was certainly a “Stumble” trajectory but what stands out is the steepness of the fall and the frequency of financing events; breathtaking
2) You might find interesting the correlation of categorization between your three share price trajectories and the total amount raised by these companies. I think you’ll find that the odds for a “Pop” or “Build” scenario (best for early stage VCs and for entrepreneurs) are greater at capitalizations of less than $80MM.
3) Some of the “Build” candidates (Gevo comes to mind since you used that example) had share value trajectories that were “built” largely off of inside financings. So would be interesting to see if in your “Build” scenarios there was a disproportionate presence of insider-led rounds as these tend to have a defensive effect on the value of the next round (my hypothesis is that the answer to this is more than obvious).
Thanks for all the work on these pieces and for sharing them. Great reading.
Hi Rodrigo — Excellent points. I’ve run the data on Solyndra as well as other companies that filed and then pulled S-1s, such as Nanosys — my inclusion criteria (IPO or outstanding S-1) excluded them from the analysis. Solyndra indeed had a steep slope.