The State of Cleantech Venture Capital: What Lies Ahead

Footsteps end on path through the woods(A version of this post also appeared at GigaOM.)

tl;dr: Cleantech VC is receding because of poor short-term performance – no surprise in a post-bubble field with outsized time and money requirements. The category is about to go on a walk in the woods, where innovators will blaze a new trail.

In late 2011 I decided to write up an internal analysis I’d done at Venrock about the state of cleantech venture capital and make it available broadly. I’m a fact-based, research-driven guy, so I tried to shine the light of data on myths and realities in the field. My macro conclusion was that while it was really early, investment returns to date were on par with VC overall.

Much has changed since then. With 2012 numbers done and dusted, I figure it’s time to revisit this topic – again, under the light of data. I’ll frame this analysis with the questions I’ve gotten from VCs and entrepreneurs who’ve asked me for an update.

What’s happening to cleantech venture capital?

It’s receding.

Cleantech VC funding by quarter, 2011-2012 (US$ millions)

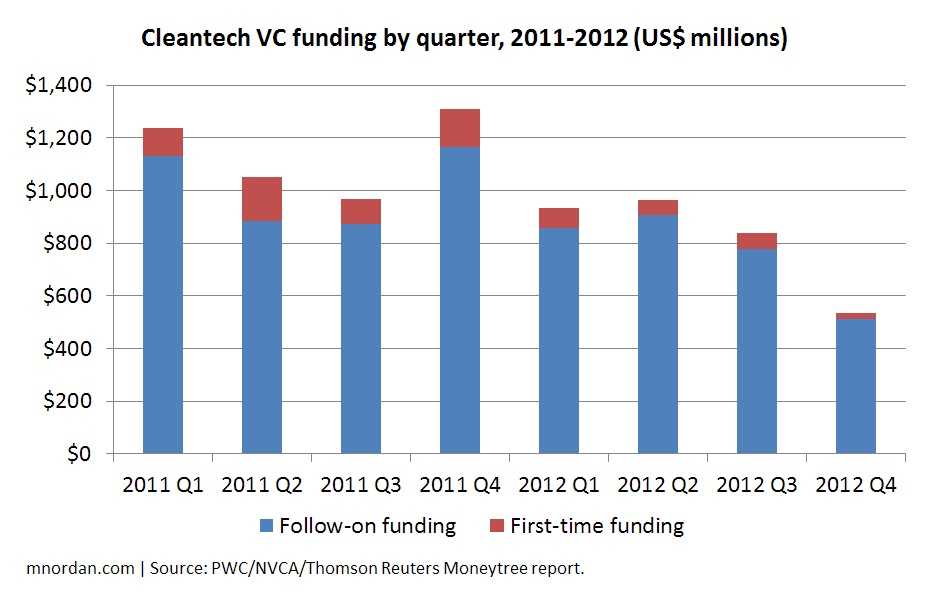
  • Investment fell 30% in 2012 – and even further at the early stage. The Moneytree survey numbers had cleantech VC investment falling from $4.6 billion in 2011 to $3.3 billion in 2012 – a 28% drop. Further, they showed first-time funding of new start-ups plummeting 58% to just $216 million, and shrinking as the year progressed: By Q4, first-time funding was just 4% of capital invested.
  • Limited partners are backing off. VC firms get the money they invest from limited partners (LPs) like foundations and pension funds. Last December Preqin called up 31 LPs that were invested in at least one cleantech-focused fund and asked if they planned to back any new ones in 2013. Only 22% said yes (down from 31% a year before).
  • The people are changing. Many VC firms parted ways with their cleantech teams in 2012. While February’s ARPA-E conference had a record number of attendees, venture investors were scarce – replaced by a bumper crop of corporate types.

Why is this happening?

Cleantech VC performance is substantially lagging venture capital as a whole. This wasn’t true in 2011, but things changed fast in 2012.

I arrive at this conclusion by comparing two data sets. On one hand, we have data on the interim performance of 19 cleantech-only VC funds as reported by the California Public Employees’ Retirement System (CalPERS), a big LP. On the other, we have equivalent data for the entire universe of VC funds from the National Venture Capital Association. (The data are expressed as “value to paid-in capital, net to LPs,” which means “the current value of the funds divided by the money put into them, accounting for what VCs pay themselves.”) By comparing cleantech-only fund performance with the full VC universe at the same points in time, we can see whether cleantech is doing better or worse than the asset class.

The answer is that cleantech went sideways in 2012 while VC overall did well. In September 2010, the cleantech VC funds were worth 0.90x the money paid into them while comparable VC funds overall were at 0.96x – roughly the same. Six months later the gap had widened, but both had risen in value and remained within spitting distance. By June of 2012, however (the most recent data available), the cleantech funds had declined slightly while the overall VC universe climbed to 1.23x.

Cleantech-only VC fund valuations vs. full VC asset class

This is why investment is stalling, LPs are hesitating, and cleantech VCs are thinning: Capital invested in other domains is showing a greater near-term return.

If minimal money had gone into cleantech, or if the macro environment were rosier, there might be more willingness to forge ahead. But today, fund managers assess the $25 billion worth of cleantech VC invested since 2003 against a backdrop of shale gas and climate apathy – and tighten the purse strings.

OK, but why is that happening? What’s driving weak cleantech VC performance?

Two factors. First, there have been too few exits.

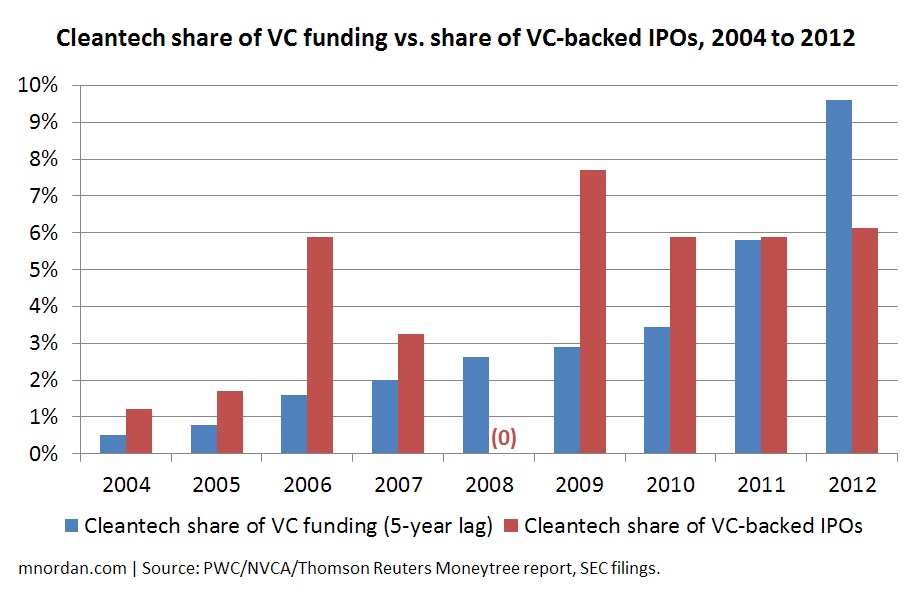
Let’s consider the gold standard of VC wins – an IPO on a major exchange. When I last did this analysis, cleantech was overperforming on the IPO front: In 2009, 2010, and 2011, cleantech’s share of VC-backed IPOs exceeded its share of VC funding. (Note: One must apply an appropriate time lag to the latter – I used five years, which is informed by deal-by-deal fundraising data by cleantech start-ups).

This ended in 2012. Just as in the prior year, three cleantech IPOs took place out of about 50 VC-backed IPOs in total (6%). But cleantech’s corresponding share of VC funding rose to 10% – so cleantech was now underperforming on exits relative to capital invested, instead of overperforming.

Cleantech share of VC funding vs. share of VC-backed IPOs, 2004 to 2012

(Of course, most VC-backed companies exit through acquisition, not an IPO. But the M&A front looks no better for cleantech. When merchant bank Jane Capital counted up every acquisition of a VC-backed cleantech start-up worth more than $50 million in the last 10 years, it found just 27 of them.)

Second, the winners have disappointed post-IPO. When a start-up goes public, its VC investors rarely get to sell their shares immediately: They have to wait out a lockup period that typically lasts six months. Of the nine VC-backed cleantech start-ups that have done major-market IPOs since 2010 and have been public for more than six months, eight were trading below their IPO price at the 180-day mark.

Aftermarket performance of cleantech IPOs completed 2010-2012

In four of those cases, the 180-day share price was also lower than the price at the last venture round. That means VCs who bought shares in that round were under water when the lockup expired.

So is the pullback in cleantech VC justified?

Well, it’s certainly expected. The cleantech gold rush of the late 2000s saw hundreds of start-ups funded – many with identical propositions – that greatly exceeded the carrying capacity of their industries: For example, there’s no way that more than a handful of the 219 solar start-ups counted by Greentech Media in 2009 could possibly succeed. This dynamic isn’t unique to cleantech. The Internet VC bubble of the late 90s was the same story, albeit on a much larger scale.

But just as the boom-and-bust in dot com investment didn’t mean this whole Internet thing was a waste, the same is true for energy and environmental technologies. It’s very likely that multiple billion-dollar companies lurk among today’s cleantech VC portfolios. The question is – given the current retrenchment of capital from the field – how many of them will get the fuel to reach the finish line.

In the main, energy and environmental start-ups need outsized time, money, and risk tolerance to reach a big outcome. (That’s not true of IT-meets-energy “cleanweb” companies like Opower or Venrock-backed Nest Labs, but it holds for the deep-tech start-ups that comprise most of the category.) As our case study, let’s take First Solar, the pioneering thin-film solar maker. The company’s first instantiation was founded in 1990; it took 12 years to ship a product, was restarted in 1999, and consumed $150 million of equity investment (all Walton family money) before its 2007 IPO. But at that outcome, First Solar was worth $1.4 billion valuing the Walton stake at 8.4x. Two years later at the peak of the solar boom, it was worth 199x!

If this is what success looks like – that is, if the majority of cleantech start-ups will need more time and money to reach big outcomes compared with VC-backed companies overall – a few conclusions follow:

  • Funds focused solely on cleantech will have a longer and deeper “J-curve” of returns compared with VC as a whole. When they reach the same final return multiple, they will take longer to do so (impacting IRR). Midway through the journey, their performance will look like an “L-curve.”
  • To the extent that cleantech start-ups’ time to exit will be 10 years or more, it’s too early to call success or failure on the current crop – because most of them were founded in 2007 or later. Check back in five years.
  • Because the time frames to an outcome are longer and the amounts of capital required are greater, cleantech investment should be less spikey compared with investment in, say, Internet start-ups. And lo and behold, that’s pretty much what we see:

Internet VC bubble vs. cleantech VC bubble, time-aligned

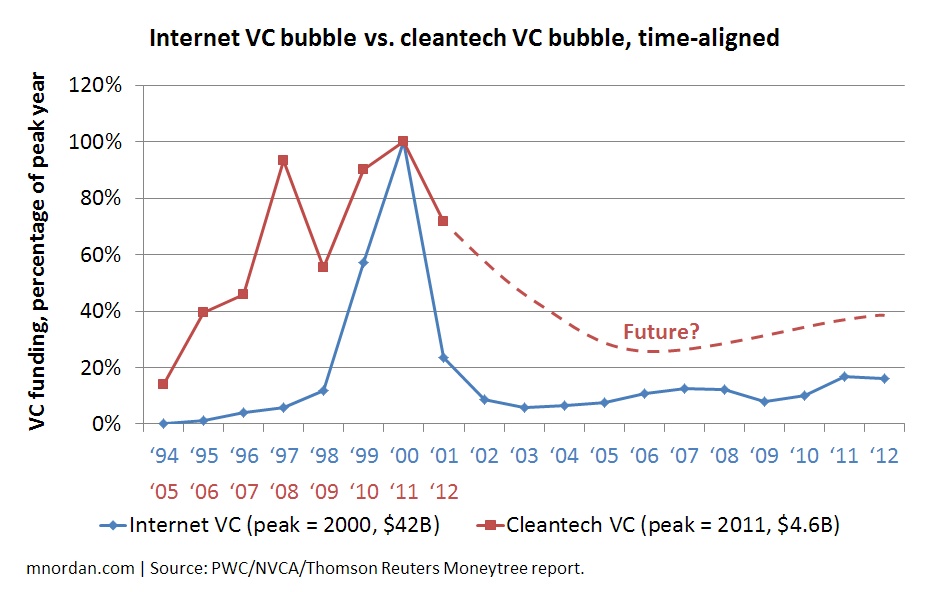
Cleantech VC now is like Internet VC in 2001: on the downward slope of a bubble, albeit with a more gradual climb and a gentler descent. Note that Facebook was conceived in 2003 – the lowest point for Internet investing post-bust – and that in 2004, Google’s IPO kicked off the renaissance that persists today.

So is the cleantech pullback justified? The data says it’s too early to call. However, it also suggests that the time frame required to reach a conclusion will greatly stretch 10-year closed-ended funds.

(A diligent reader may point out my own numbers showing that when VC-backed cleantech start-ups have gone public, they’ve mostly done so in less than 10 years. My take is that most of these companies were rushed to public markets before they were ready – explaining the awful aftermarket performance.)

What happens now?

Cleantech innovation is about to take a walk in the woods. Justified or not, the established path of VC-backed investment is narrowing for a generation of start-ups. Some of those companies – and some of the investment managers that have backed them – will break off into the wilderness to find a new route.

In this environment, I see opportunities in:

  • Selective recaps. About 270 cleantech start-ups can be characterized as “late stage” (they’ve raised Series C rounds or later). Of those, about 150 have demonstrated proof of economics and are focused on scale-up. If capital keeps receding, there won’t be nearly enough money to fund them to exit – enabling savvy late-stage financiers to pick off the best of the bunch in recaps that reap disproportionate returns. In 2011 I thought this capital gap wouldn’t persist, because the likes of VantagePoint and Silver Lake Kraftwerk were out raising huge funds aimed at it; the failure and scale-back of those efforts leaves the opportunity open.
  • Cross-border plays. The U.S. dominates cleantech innovation, but China and other overseas nations dominate deployment. New vehicles are mobilizing to provide cleantech equity investment coupled with cross-border JV creation and operational help – including Formation8 and a stealth-mode firm I can’t reveal.
  • Strategic investment, rethought. Large corporations in industrials and energy have strategic motivations to foster cleantech start-ups: The likes of GE and General Motors want an innovation pipeline, while utilities want a stream of new equipment to rate-base. Institutions are forming to organize this activity in a merchant banking model, like Broadscale at the late stage and OnRamp Capital at the early.
  • Foreign techno-colonialism. While U.S. investors bemoan a lack of capital for cleantech, many foreign institutions are awash in it – and view American assets as being generally cheap. To U.S. start-ups, they will play a role somewhere on a continuum between savior (e.g. Japanese trading houses bankrolling cleantech start-ups to get the inside track on project financing) and reaper (e.g. Wanxiang’s A123Systems deal).
  • Philanthropic capital. The cleantech projects that would most change the world – think electrofuels, solar antennae, advanced nuclear power – are also the least likely to be funded, because they combine long time frames with extraordinary risk. There is a case to be made for impact investment in these fields using philanthropic capital as a charitable activity. A new effort called PRIME, backed by four visionary family foundations, is leading this charge.

It’s hard out there for cleantech. The woods are scary and the journey is uncertain. But pioneers are charting a new path through the thicket – blazing trails that others will follow.

Advertisement
Posted in Numbers, The State of Cleantech VC 2012, Venture capital | 8 Comments

The Very Curious Hybrid Boom

tl;dr: U.S. hybrid vehicle sales were up 61% in 2012. It’s unclear why.

Riddle me this: Why did U.S. hybrid sales take off last year?

Prior to 2012, hybrids looked like something between a fad and a niche. Sales peaked in absolute terms way back in 2007 and hybrid market share maxed out in 2009. Despite rising gasoline prices, it seemed that Americans cared neither about getting 50 miles per gallon or the environmental benefits thereof.

Then last year happened.

U.S. hybrid vehicle sales and market share, 1999 to 2012

Hybrid sales rose 61% to 434,498 cars in 2012 – the biggest absolute increase ever and the biggest percentage gain in seven years. Hybrids accounted for 3.0% of new vehicles sold, up 42% from 2011.

The big question: Why?

It wasn’t new choices. While nine new hybrid models were introduced in the States in 2012 (of a total 44 available), they accounted for only 9,708 hybrids sold (2.2%) – and the Prius took half the market like it has since 2009.

It wasn’t a price drop. Prius sticker prices fell $2,500 last year (about 11%) as Toyota restocked post-Fukushima, but prices of conventional non-hybrid cars from Japan dropped too.

It wasn’t higher gas prices. Retail gasoline prices were nearly flat from 2011 to 2012. (And if the gas price determined sales, hybrids should have peaked in 2008 and plummeted the year after; neither one happened.)

It wasn’t an improving economy. Real GDP growth was 2.2% in 2012 and 2.8% in 2010. Yet hybrid market share blew up in 2012 and shrank in 2010.

It wasn’t more driving. In fact, annual vehicle miles traveled per person fell slightly in 2012, extending a trend that started in 2004. “Peak car,” anyone?

U.S. gas price/GDP/vehicle miles traveled vs. hybrid market share, 1999 to 2012

None of these things correlate and it makes no sense! Any ideas?

Posted in Consumers, Numbers, Transportation | 10 Comments

Entrepreneur Tools: The Returns Analysis

tl;dr: To successfully target VCs, view your deal through their eyes.

pov2I got an outstanding piece of advice in my first job: “Always see the world from the other person’s point of view.”

If you’re trying to sign the pivotal customer, think from their perspective about what price they can accept. If you’re trying to recruit the killer engineer, understand how she weighs moving her kids when they’re halfway through elementary school.

And if you’re trying to raise capital from a VC – someone who invests other people’s money, and is out of a job if there’s insufficient return – analyze your own deal the same way he will.

I learned this the hard way.

In 2007 a somewhat younger and substantially less gray-haired Matthew was out raising a venture capital round for my previous company Lux Research. The good news is that it ended well – we were fortunate to bring on west coast VC firm Catamount Ventures, where partner Mark Silverman brought a rare combo of vision and pragmatism to the board. The bad news is that I wasted a lot of time pitching to firms that I should have known weren’t a good fit in advance, because the returns math couldn’t work for them.

My mission today is to arm you so you don’t make the same mistake.

When a VC investor hears your pitch, he’ll do math in his head to figure out if your company is in-bounds. (While bigger factors like team and market determine a “yes,” the math can rule out a “no.”) Typically, he’s answering two questions:

over90001) Can this investment move the needle? A venture investor can only attend to so many portfolio companies at once. To earn one of these limited slots, an investment has to be “needle-moving:” A successful outcome must be big enough in absolute terms to warrant a spot (regardless of the ratio of dollars out to dollars in).

As you can imagine, what’s needle-moving depends on the size of the fund that’s making the investment. A billion-dollar fund needs billion-dollar IPOs to return a profit; while investing $1 million into a company and getting $10 million back would yield a phenomenal 10x return multiple, you’d need 100 such outcomes just to break even! On the other hand, the same $10MM-for-$1MM return would be massive to a $10MM seed fund, where that single investment would put the fund in the black.

While there’s no magic number, a decent rule of thumb is that a needle-moving investment must return at least 10% of the fund to the VC in the success case. Here’s a close-to-home example: At Venrock we’re currently investing out of a $350MM fund. “Needle-moving,” according to this heuristic, is therefore $35MM. We tend to own 20% or so of the companies we invest in on average, so any one of them must be capable of being worth $35MM / 20% = $175MM when it’s bought or goes public – at an absolute minimum. If a successful outcome for your company would be getting acquired for $20-30 million dollars, you should not pitch me; target other investors with more appropriately-sized pools of capital who would view this outcome as a big win.

returnpaint2) Is the return multiple big enough? After assessing the absolute return, the math moves on to the return multiple, which is a relative measure. If everything goes right, how many dollars will I get out for each dollar I put in?

The return multiple that a VC investor seeks depends on the stage at which it invests, because of the time value of money: You earn about 8%/year if you make 2x your money over 10 years, but you could earn the same 8% by getting 1.08x in one year. As a result, early-stage investors (who invest at company founding and go 5-10 years before seeing an outcome) target higher returns than growth-stage investors, who aim to put in money shortly before the acquisition or IPO. Also, early-stage investors fund younger, riskier companies, most of which fail. Therefore they seek higher multiples in the success case than do growth-stage investors, who make some profit on most of the companies they back.

Again, there’s no magic number, but a good rule of thumb is that an early-stage VC needs to be able to envision a 10x return multiple if everything goes right. (A growth-stage investor, on the other hand, may see 2x to 5x as the target to hit.)

Armed with these principles, you can model the investment returns that a VC would get by putting money into your company, and use that information to target your investor search. Use the spreadsheet template that you can download here (which I’m archiving on the tools page) to do the math and model the return from the VC’s perspective. As inputs, you’ll need your financial projections (revenue, cost of goods sold, and opex); your capital plan (how much money you’ll need to raise and when); and a valuation metric (the spreadsheet uses price-to-sales, but you could also use price-to-earnings – in any case, set the metric by looking at comparable companies that have gone public or been acquired, and use a conservative consensus number in the model). What you’ll get out is the VC’s absolute return and return multiple.

As an example, consider this case:

returns_example3

Let’s say that this company is an energy analytics start-up trying to figure out if it should pitch to VC X, an early-stage investor with a $300MM fund. The company is raising a $10MM Series A aiming for a $15MM pre-money valuation, and thinks it will need another $25MM in two years to get to profitability. It believes it will have $80MM in revenue at year six, and an analysis of comparables shows that similar companies have been bought or gone public at 5x revenue. VC X would do half the A round ($5MM, purchasing 20% ownership) and invest its pro rata amount of the round to follow (i.e., 20% of the $25MM B round = $5MM more in two years), for $10MM invested over the life of the company (if everything goes right).

The good news is that, from VC X’s perspective, the investment clears the “needle-moving” hurdle. If the company hits its $80MM revenue target in six years, it’s worth $80MM x 5x = $400MM; VC X will own 20%, so its absolute return of $80MM is well above 10% of VC X’s $300MM fund size.

The bad news is that VC X can’t quite see its way to a 10x return. It’s going to put in $10MM in total ($5MM now and $5MM later) for an $80MM absolute return, yielding a multiple of $80MM / $10MM = 8x. This is good, but not excellent if it’s an upper bound; if it represents a true maximum it may not be enough. There would likely need to be compensating positive factors (phenomenal team, opportunity to expand to other markets, a pivotal early partner, demonstrably active acquirers) for this opportunity to compete against others.

A secondary point worth noting: The $10MM invested over the life of the company would be 3.3% of VC X’s fund – big enough to be a “real” investment worth a partner’s time, but not so large that it sucks up too much of the fund (VCs generally avoid putting more than 5%-10% of a fund behind any one company).

When you go through this exercise, run multiple scenarios – the VC you’re pitching certainly will! See what things look like with a slower revenue ramp, a lower valuation metric, a higher capital requirement (Venrock lore holds that companies typically require 2.5x more money over their lives than they anticipate at first fundraising), etc. However, I don’t recommend putting this kind of analysis into your pitch deck – it presupposes too much knowledge of the other party’s motivations and comes off as kind of arrogant. Keep it to yourself and use it to inform your financial plan.

Hopefully this tool will equip you for more successful fundraising. Let me know your feedback, and please point out my inevitable Excel errors for correction in an update…

Posted in Numbers, Unsolicited advice, Venture capital | 1 Comment

Installing a Nest, Investing in Nest

tl;dr: Nest Labs performs magic – making energy efficiency awesome, even for the nontechnical and non-green. We’re delighted to invest in the company.

Back in February I acquired a Nest Learning Thermostat, famously designed by Apple’s original iPhone team. Looks cool! Learns your habits! Controlled from your phone! At the time, I felt the product was something of an overhyped fetish object for energy nerds, but I was happy to get one as I sit squarely in that demographic. (Plus, while the Honeywell thermostats in our home were nominally programmable, their interface was so obtuse that we never set them and thus wasted money.) Behold the tweet:

And then it sat in the box for four months.

It’s not that I didn’t want a beautiful piece of industrial design on my wall – it’s that I believed installing a thermostat was a perilous project that would consume a weekend afternoon. Every time Mrs. Nordan and I thought “you know, we really ought to put that thing up,” we quickly found a reason to do something else. And so it sat in the box.

Until June, when my colleague Matt Trevithick came over for dinner and asked me how we liked our Nest. I sheepishly responded that it hadn’t made it to the wall. Matt assured me that the setup was super-easy (he had one) and declared that we’d be doing the installation that very second.

Mrs. Nordan and I accepted the challenge. The ground rules: she’d 1) do the whole thing, 2) use only what came in the box, and 3) time it (it’s supposed to be a half-hour job). If you want the details, see this photo log, but the bottom line is that Matt was right. The entire process was simple; every conceivable thought was given to user-friendliness (down to the bubble level built into the backplate, so as not to install the thing crooked); and the network and app connectivity “just worked.” We clocked in at 22 minutes for the install, followed by 15 minutes’ worth of software updates (that’s what I get for waiting months to activate the thing).

Done. Niche nerd product: operational.

But in the two months that followed, it became clear that this was not a niche nerd product. I had underestimated Nest. As I used the thing, I saw that:

  • The experience was legitimately great. Our old beige box seemed out of place in a house otherwise filled with stainless steel; the Nest just looked better. We never programmed the old box because it was so awkward; the Nest had an iPad app. Even basic stuff was better – the AC would kick right in after we set the dial on the Nest instead of incurring a mysterious delay like before. I’d thought that setting the temperature from your phone was a stupid idea, until I found myself doing exactly that when I’d land at the airport late at night and wanted the downstairs to be cool before I got home.
  • It appealed to non-techies and the non-green. Most people who walked into our house and saw the thing wanted one, even those lacking a sustainability gene; they looked at it like an iPhone, not a climate controller. It became a living room conversation piece, like a stereo in the 1960s (I think of Pete on Mad Men). When Mrs. Nordan – a deeply nontechnical gadget-phobe – decided that it would make a great Christmas gift, the breadth of appeal became clear.
  • It delivered energy efficiency effortlessly. Nest’s default mode is to learn your schedule and make your house more efficient – thus saving you money – without you having to do anything. Little things that are transparent to the user, like turning on just the fan instead of the A/C compressor when it makes sense to do so, simply happen; you don’t have to know (or care). Every Nest household is a potential demand response node that doesn’t require the utility to roll a truck. Combined, those homes are a trove of fine-grained data that can be used to target retrofits.

I concluded that I wasn’t looking at a better thermostat. This was something else: the reinvention of an unloved category via thoughtful design. Nest was to its ilk what the Prius was to cars, what Tivo was to VCRs, or – best comparison – what Dyson was to vacuum cleaners (20% market share in the U.S. at 4x the average price point just three years after introduction). And if this team could make a thermostat (of all things) into an engaging product, who knows what else they’d come up with?

Shortly thereafter our energy team at Venrock evaluated Nest Labs as a venture investment. I’ve written before in this space that the smart grid has been a failure for consumers because it’s all too complicated and no one cares. To change the input/output ratio of consumption, the experience has to be awesome, winning on merits instead of getting by on shame. Having looked at this field for many years we’ve seen a ton of consumer energy propositions; Nest was the first one to clear this essential bar.

We’re pleased that Venrock is investing in Nest and backing a phenomenal team with an expansive vision. Matt, Ray Rothrock, and I – all of whom happened to be users before we were investors – are on the case. For her part, Mrs. Nordan has the second Nest unit going in upstairs.

Posted in Consumers, Energy efficiency, Smart grid | 4 Comments

Nest Installation Photo Log

tl;dr: Mrs. Nordan vs. Nest thermostat! Will it take an afternoon to install? Will we ruin our house in the process? No on both counts!

In June we installed a Nest Learning Thermostat in chez Nordan; I helmed the camera for the obligatory unboxing post, but promptly got occupied with other things and left the pics to languish on my laptop. Better late than never? For context on why I’m posting this months after the fact, see “Installing a Nest, Investing in Nest.”

Challenge accepted.

What’s in the box. What you can’t see here (because we were speeding through it and/or I am a lazy photographer) is that the screwdriver, wall screws, anchors, etc. needed to get the thing mounted are in the box too.

On the chopping block: The inscrutable Honeywell thermostat that we’re replacing.

Honeywell with the faceplate off. See those wires? They provide power and talk to the HVAC system. Our mission is to get them plugged into the right spots on the Nest.

The Nest box includes little labels to wrap around the wires as you unplug them, so you won’t forget which is which when you have to plug them back in. We duly attach them.

Penciling in holes where we’ll put the anchors for the wall screws. More user-friendliness: Note that the Nest’s backplate has a level built into the front of it so you won’t mount the thing crooked.

Drillin’. We probably could have just bored a hole, but, you know, completeness.

In go the anchors.

Attaching the backplate.

Good. Now time to plug the wires into the tabs. The labels on the wires have letters on them that match up to the tabs, so even we can’t screw this up.

Fiddling…

Done. Once the wires are plugged in you moosh them back before attaching the faceplate.

Faceplate goes on…

…and we’re up! Note that the display doesn’t actually look like that – it looks like a normal LCD display – it just showed up with these artifacts when captured through my camera.

Connecting the Nest to WiFi. Once we’ve done this, the stopwatch reads 22 minutes, at which time we’re done with the physical install. But, this being 2012, we wouldn’t be done without…

…software updates, of which we got three, totaling 15 minutes altogether; the Nest rebooted itself between each. This was the only annoying part of the installation and one that took longer than I expected (how big can a thermostat firmware update be?) I presume that if we hadn’t waited four months between getting the thing and installing it we wouldn’t have had three of these in a row. While it’s downloading, let’s get the iPhone app running:

App store entry. Confidence-inspiring rating.

On its way…

The app finds the Nest automatically; we have to click the thermostat itself to complete the enrollment. (I find myself wondering if/how/when this could be hacked. Be ever vigilant, Nest Labs.)

Success!

Total time: 37:09.6, roughly 22 minute install + 15 minutes of software updates.

Posted in Consumers, Energy efficiency, Smart grid | 2 Comments